Monitoring reputer health

In this post, I will focus on establishing topic health by evaluating the performance of reputers. The idea here is to design an empirical model that can assess how well reputers are functioning within the network. Here we are looking for two key factors: similar reported losses and similar stake across reputers.

To break this down, I’ll be developing two separate metrics. The first metric will focus on evaluating the consensus among reputers by measuring how similar their reported losses are. Ideally, reputers should report consistent losses if they are all functioning correctly, and this consistency would indicate good health.

The second metric will examine the similarity in reputers’ stakes. In a healthy system, we want to ensure that no single reputer dominates by holding a disproportionate amount of stake.

I’m going to start with the first metric and ensuring the reported losses are similar.

We are going to focus on reputer scores (eq 32 in the WP). This score is already available on chain and is essentially the distance to consensus.

For the scores, we want a combination of them being both high and similar. The corresponds to the healthy case where every reputer is close to consensus.

My proposed metric is as follows:
image
So just a ratio of the mean to the standard deviation. Basically a modified coefficient of variation. This is largest when scores are large and similar, and smallest when scores are small and different. The parameter k lets us control how much we want to penalise heterogeneity. Epsilon avoids division by 0.

I am performing MC simulations assuming the scores are gaussian.
For each sim

  • Uniformly pick a mean score between 0 and 500
  • Uniformly pick a number of reputers between 10 and 1000
  • Uniformly pick a stdev for the reputer scores between .1 and 20
  • Generate the scores (gaussian)
  • Calculate the metric

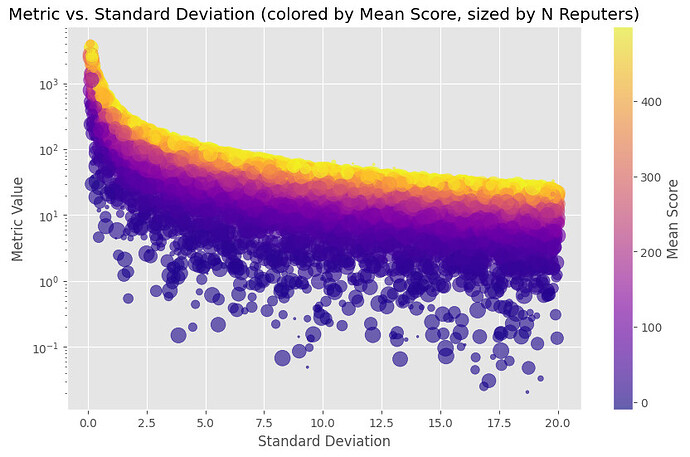
For epsilon I am using 1e-6. The metric can be huge so I am using a log scale. Here are the results for k=1:


In the first plot we see the metric is very small for small means, and becomes large for large means. In the second plot, the metric decreases as the stdev increases. But when stdev is high and mean is large the metric is still relatively large. In the last plot we see this is robust to the number of reputers.

We can make the second plot decrease faster by increasing k.

Testing k=2:


I like this. The drawback is that the first plot now has larger values.

This is the second metric, to quantify reputer stake’s being similar.

We take the reputer stakes as an input. For a metric I am using and improved version of the normalised entropy metric used for topics and validators. Since I am using entropy I am really working with stake fractions here. I assume the stakes follow a power law (using the same parameters as I did for topics).

Reminder of the PL parameters I used:

x_min = 1

log_xmax_xmin_range = np.arange(0.5, 3.5, 0.5)

alphas = [-1.01, -1.51, -2.01, -2.51, -3]

It is improved thanks to @Apollo11’s recommendation to scale the dynamic range: Reminder of the PL parameters I used:

x_min = 1

log_xmax_xmin_range = np.arange(0.5, 3.5, 0.5)

alphas = [-1.01, -1.51, -2.01, -2.51, -3]

It is improved thanks to dynamic range scaling via:
image
This was @Apollo11’s idea, thank you!!!

I am using C=100 for the simulations below. I am also testing two versions of entropy now:
Vanilla entropy:

def entropy(pmf):

    return -np.sum(pmf * np.log(pmf))

The scaled entropy from the white paper:

def entropy_WP(pmf, beta):

    N = len(pmf)

    N_eff = 1/np.sum(pmf**2)

    return -np.sum(pmf * np.log(pmf))*(N_eff/N)**beta

I used beta=0.25.

First vanilla entropy:

Here are the results for C=100, vanilla entropy, and 100 reputers:


Coloured by alpha:

Colorued by log(max/xmin):

Now results for C=100, vanilla entropy, and 2000 reputers:


Now results using entropy from the white paper:

C=100, white paper entropy, and 100 reputers:


C=100 seems to be much too large when using the white paper entropy, testing with C=10.

100 reputers:


2000 reputers:


I love how close to linear the left scatter plots are using the white paper entropy and C=10. I picked C arbitrarily based on observations. Not exactly sure how to pick the best C but I can experiment more. My concern with this metric is how the lower bound of the metric is around 0.4 for 2000 reputers, and 0.2 for 100 reputers. This does not occur using vanilla entropy and C=100. But this isn’t necessarily bad, a lower metric corresponds to less health, and 100 reputers is worse than 1000 reputers

This one I really like. One question though: is it obvious that a shallower PL is worse? alpha=0 means that there are a similar number of reputers at each stake (high stdev), whereas a very steep PL (alpha << 0) means that there are mostly low-stake reputers, with high-stake ones being very rare (low stdev).

Part of me leans to the former, despite the high stdev, because there is no domination by a single, high-stake entity. But I suppose the point might be that most of the stake sits with low-stake participants… so then a single one cannot dominate. This is true in general actually. If you integrate a PL with index alpha then most of the total capital accumulates at rich holders if alpha is shallower than -2 (so >-2), and it accumulates at poor holders if alpha is steeper than -2 (so <-2). (This is why the alpha range I suggested straddles -2.)

So maybe this is why the behaviour we see is desirable. It’d be great if you could maybe reflect on your results in the context of the above points.

Hmmmm. I guess so far I have just been looking for similar stake, so my thought was the case that the low stdev case is the desirable case and did not really think about that much lol.

But here is my reflection: Like you pointed out a shallow PL leads to the concentration of wealth at the rich holders. So the case of shallow PL corresponds to centralisation. We love decentralisation, therefore a shallow PL is obviously worse than a steep PL.

So if we consider the case of steep PL and high entropy healthy - this means having mainly low stake reputers is healthy. I feel like there has to be some drawback here. With most of the stake held by many small entities, the network might experience lower stability in governance or validation.

So I guess the question is do we care more about decentralisation or potential instability?

I suppose it’s a combination of alpha and xmax/xmin. I would want the stdev to be low at fixed alpha, because that’d imply low xmax/xmin. But whether or not I want alpha to be high or low is not obvious, as is clear from this discussion. It just somehow feels off to say I want a steep PL…

“I want the stdev to be low at fixed alpha.” I think that makes sense. And I think we are picking that up with this metric in both cases - I made some plots with fixed alpha. For 2000 reputers with alpha fixed at -3:


and alpha = -1


For both cases the metric approaches one as the stdev decreases. In the steep case, the entropies tend to be larger and more clustered for log(x_max/x_min)>1, but there is still a large gap between log(x_max/x_min)=0.5 and log(x_max/x_min)=1. In the shallow case everything is more spread out.

I also have been using natural log for log(x_max/x_min). when you say “log(xmax/xmin) can range from 0.5 to 3 in 0.5 steps” so you mean natural log or log10? if it was log10, my bad and the above results are:
alpha=-3


alpha=-1

Thanks! This is very nice.

(Yes, for me always log == log_10 and ln == log_e :smiley:)